 Công nghệ
  Windows
  iPhone
  Android
  Học CNTT
  Download
  Tiện ích
  Khoa học
  Game
Game  Làng CN
  Ứng dụng
 Code mẫu biểu đồ được đồng bộ hóa trong JavaScript

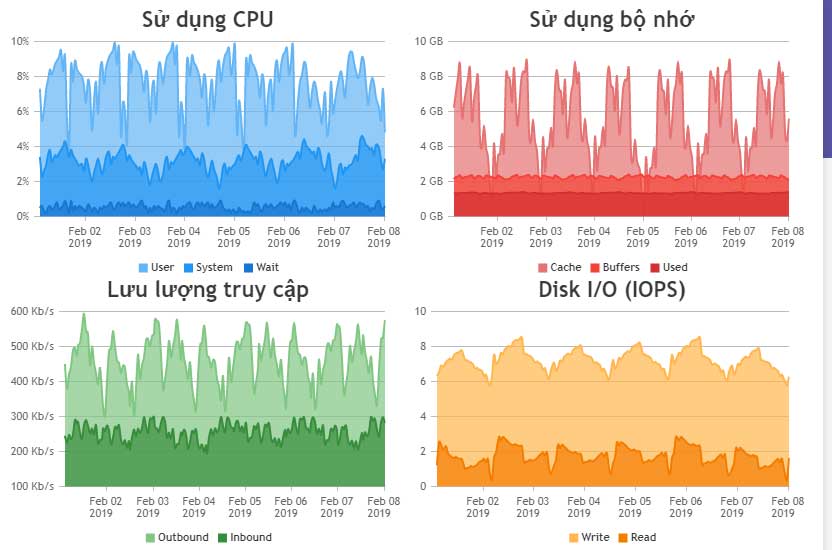
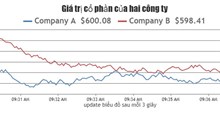
Code mẫu biểu đồ bằng JavaScript dưới đây khá đặc biệt. Tất cả đều được đồng bộ với nhau. Dưới đây là ví dụ code mẫu JavaScript tại biểu đồ kèm ví dụ trực quan.
Dù có thể hiển thị dữ liệu trên nhiều biểu đồ, bạn có thể “hình ảnh hóa” chúng tốt hơn bằng cách dùng Synchronized Charts - Đồng bộ hóa biểu đồ/đồ thị. Dạng biểu đồ này là nơi tooltip, đường chéo & phạm vi trục được đồng bộ trên các biểu đồ. Ví dụ, nếu bạn phóng to, thu nhỏ hoặc xoay bất kỳ một trong số các biểu đồ, nó sẽ tự động zoom/pan các biểu đồ khác. Điều đó cũng diễn ra trên Tooltip & Crosshair.
Dưới đây là ví dụ về code mẫu JavaScript tạo biểu đồ được đồng bộ hóa cùng với mã nguồn mà bạn có thể chạy trên máy tính:
<!DOCTYPE HTML>
<html>
<head>
<script>
window.onload = function () {
  var charts = [];
  var toolTip = {
    shared: true
  },
  legend = {
    cursor: "pointer",
    itemclick: function (e) {
      if (typeof (e.dataSeries.visible) === "undefined" || e.dataSeries.visible) {
        e.dataSeries.visible = false;
      } else {
        e.dataSeries.visible = true;
      }
      e.chart.render();
    }
  };

  var systemDps = [], userDps=[], waitDps = [], buffersDps = [], cacheDps = [], usedDps=[], inboundDps = [], outboundDps = [], writeDps = [], readDps = [];

  var cpuChartOptions = {
    animationEnabled: true,
    theme: "light2", // bạn có thể thay bằng "light1", "light2", "dark1" hoặc "dark2"
    title:{
      text: "Sử dụng CPU"
    },
    toolTip: toolTip,
    axisY: {
      valueFormatString: "#0.#%",
    },
    legend: legend,
    data: [{
      type: "splineArea",
      showInLegend: "true",
      name: "User",
      yValueFormatString: "#0.#%",
      color: "#64b5f6",
      xValueType: "dateTime",
      xValueFormatString: "DD MMM YY HH:mm",
      legendMarkerType: "square",
      dataPoints: userDps
    },{
      type: "splineArea",
      showInLegend: "true",
      name: "System",
      yValueFormatString: "#0.#%",
      color: "#2196f3",
      xValueType: "dateTime",
      xValueFormatString: "DD MMM YY HH:mm",
      legendMarkerType: "square",
      dataPoints: systemDps
    },{
      type: "splineArea",
      showInLegend: "true",
      name: "Wait",
      yValueFormatString: "#0.#%",
      color: "#1976d2",
      xValueType: "dateTime",
      xValueFormatString: "DD MMM YY HH:mm",
      legendMarkerType: "square",
      dataPoints: waitDps
    }]
  };
  var memoryChartOptions = {
    animationEnabled: true,
    theme: "light2",
    title:{
      text: "Sử dụng bộ nhớ"
    },
    axisY: {
      suffix: " GB"
    },
    toolTip: toolTip,
    legend: legend,
    data: [{
      type: "splineArea",
      showInLegend: "true",
      name: "Cache",
      color: "#e57373",
      xValueType: "dateTime",
      xValueFormatString: "DD MMM YY HH:mm",
      yValueFormatString: "#.## GB",
      legendMarkerType: "square",
      dataPoints: cacheDps
    },{
      type: "splineArea",
      showInLegend: "true",
      name: "Buffers",
      color: "#f44336",
      xValueType: "dateTime",
      xValueFormatString: "DD MMM YY HH:mm",
      yValueFormatString: "#.## GB",
      legendMarkerType: "square",
      dataPoints: buffersDps
    },{
      type: "splineArea",
      showInLegend: "true",
      name: "Used",
      color: "#d32f2f",
      xValueType: "dateTime",
      xValueFormatString: "DD MMM YY HH:mm",
      yValueFormatString: "#.## GB",
      legendMarkerType: "square",
      dataPoints: usedDps
    }]
  }
  var networkChartOptions = {
    animationEnabled: true,
    theme: "light2",
    title:{
      text: "Lưu lượng truy cập"
    },
    axisY: {
      suffix: " Kb/s"
    },
    toolTip: toolTip,
    legend: legend,
    data: [{
      type: "splineArea",
      showInLegend: "true",
      name: "Outbound",
      color: "#81c784",
      xValueType: "dateTime",
      xValueFormatString: "DD MMM YY HH:mm",
      yValueFormatString: "#.## Kb/s",
      legendMarkerType: "square",
      dataPoints: outboundDps
    },{
      type: "splineArea",
      showInLegend: "true",
      name: "Inbound",
      color: "#388e3c",
      xValueType: "dateTime",
      xValueFormatString: "DD MMM YY HH:mm",
      yValueFormatString: "#.## Kb/s",
      legendMarkerType: "square",
      dataPoints: inboundDps
    }]
  }
  var diskChartOptions = {
    animationEnabled: true,
    theme: "light2",
    title:{
      text: "Disk I/O (IOPS)"
    },
    axisY: {},
    toolTip: toolTip,
    legend: legend,
    data: [{
      type: "splineArea",
      showInLegend: "true",
      name: "Write",
      color: "#ffb74d",
      xValueType: "dateTime",
      xValueFormatString: "DD MMM YY HH:mm",
      yValueFormatString: "#.## ops/second",
      legendMarkerType: "square",
      dataPoints: writeDps
    },{
      type: "splineArea",
      showInLegend: "true",
      name: "Read",
      color: "#f57c00",
      xValueType: "dateTime",
      xValueFormatString: "DD MMM YY HH:mm",
      yValueFormatString: "#.## ops/second",
      legendMarkerType: "square",
      dataPoints: readDps
    }]
  }

  charts.push(new CanvasJS.Chart("chartContainer1", cpuChartOptions));
  charts.push(new CanvasJS.Chart("chartContainer2", memoryChartOptions));
  charts.push(new CanvasJS.Chart("chartContainer3", networkChartOptions));
  charts.push(new CanvasJS.Chart("chartContainer4", diskChartOptions));

  $.get("https://canvasjs.com/data/gallery/javascript/server-matrics.json", function(data) {
    for (var i = 1; i < data.length; i++) {
      systemDps.push({x: parseInt(data[i].time), y: parseFloat(data[i].system)});
      userDps.push({x: parseInt(data[i].time), y: parseFloat(data[i].user)});
      waitDps.push({x: parseInt(data[i].time), y: parseFloat(data[i].wait)});
      buffersDps.push({x: parseInt(data[i].time), y: parseFloat(data[i].buffers)});
      cacheDps.push({x: parseInt(data[i].time), y: parseFloat(data[i].cache)});
      usedDps.push({x: parseInt(data[i].time), y: parseFloat(data[i].used)});
      inboundDps.push({x: parseInt(data[i].time), y: parseFloat(data[i].inbound)});
      outboundDps.push({x: parseInt(data[i].time), y: parseFloat(data[i].outbound)});
      writeDps.push({x: parseInt(data[i].time), y: parseFloat(data[i].write)});
      readDps.push({x: parseInt(data[i].time), y: parseFloat(data[i].read)});
    }
    for( var i = 0; i < charts.length; i++){
      charts[i].options.axisX = {
        labelAngle: 0,
        crosshair: {
          enabled: true,
          snapToDataPoint: true,
          valueFormatString: "HH:mm"
        }
      }
    }

    syncCharts(charts, true, true, true); // syncCharts(charts, syncToolTip, syncCrosshair, syncAxisXRange)

    for( var i = 0; i < charts.length; i++){
      charts[i].render();
    }

  });

  function syncCharts(charts, syncToolTip, syncCrosshair, syncAxisXRange) {

    if(!this.onToolTipUpdated){
      this.onToolTipUpdated = function(e) {
        for (var j = 0; j < charts.length; j++) {
          if (charts[j] != e.chart)
            charts[j].toolTip.showAtX(e.entries[0].xValue);
        }
      }
    }

    if(!this.onToolTipHidden){
      this.onToolTipHidden = function(e) {
        for( var j = 0; j < charts.length; j++){
          if(charts[j] != e.chart)
            charts[j].toolTip.hide();
        }
      }
    }

    if(!this.onCrosshairUpdated){
      this.onCrosshairUpdated = function(e) {
        for(var j = 0; j < charts.length; j++){
          if(charts[j] != e.chart)
            charts[j].axisX[0].crosshair.showAt(e.value);
        }
      }
    }

    if(!this.onCrosshairHidden){
      this.onCrosshairHidden =  function(e) {
        for( var j = 0; j < charts.length; j++){
          if(charts[j] != e.chart)
            charts[j].axisX[0].crosshair.hide();
        }
      }
    }

    if(!this.onRangeChanged){
      this.onRangeChanged = function(e) {
        for (var j = 0; j < charts.length; j++) {
          if (e.trigger === "reset") {
            charts[j].options.axisX.viewportMinimum = charts[j].options.axisX.viewportMaximum = null;
            charts[j].options.axisY.viewportMinimum = charts[j].options.axisY.viewportMaximum = null;
            charts[j].render();
          } else if (charts[j] !== e.chart) {
            charts[j].options.axisX.viewportMinimum = e.axisX[0].viewportMinimum;
            charts[j].options.axisX.viewportMaximum = e.axisX[0].viewportMaximum;
            charts[j].render();
          }
        }
      }
    }

    for(var i = 0; i < charts.length; i++) {

      //Sync ToolTip
      if(syncToolTip) {
        if(!charts[i].options.toolTip)
          charts[i].options.toolTip = {};

        charts[i].options.toolTip.updated = this.onToolTipUpdated;
        charts[i].options.toolTip.hidden = this.onToolTipHidden;
      }

      //Sync Crosshair
      if(syncCrosshair) {
        if(!charts[i].options.axisX)
          charts[i].options.axisX = { crosshair: { enabled: true }};

        charts[i].options.axisX.crosshair.updated = this.onCrosshairUpdated;
        charts[i].options.axisX.crosshair.hidden = this.onCrosshairHidden;
      }

      //Sync Zoom / Pan
      if(syncAxisXRange) {
        charts[i].options.zoomEnabled = true;
        charts[i].options.rangeChanged = this.onRangeChanged;
      }
    }
  }

}
</script>
<style>
  .row:after {
    content: "";
    display: table;
    clear: both;
  }
  .col {
    float: left;
    width: 50%;
    height: 270px;
  }
</style>
</head>
<body>
<div class="row">
  <div class="col"id="chartContainer1"></div>
  <div class="col" id="chartContainer2"></div>
</div>
<div class="row">
  <div class="col" id="chartContainer3"></div>
  <div class="col" id="chartContainer4"></div>
</div>
<script type="text/javascript" src="https://canvasjs.com/assets/script/jquery-1.11.1.min.js"></script>
<script src="https://canvasjs.com/assets/script/canvasjs.min.js"></script>
</body>
</html>
Nguồn: CanvaJS
Tùy biến biểu đồ
Ví dụ trên đang dùng các sự kiện và phương pháp sau:
- Chart - rangeChanging, rangeChanged
- ToolTip - updated, hidden, showAtX, hide
- Crosshair - updated, hidden, showAt, hide
Bạn nên đọc
-

Code mẫu JavaScript tạo biểu đồ/đồ thị với Zoom và Pan
-
Code JavaScript tạo biểu đồ/đồ thị đường dạng động
-
Code mẫu biểu đồ & đồ thị JavaScript với label Index/ Data
-
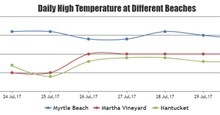
Code mẫu biểu đồ nhiều chuỗi dữ liệu trong JavaScript
-
Code JavaScript tạo biểu đồ đa chuỗi update dữ liệu trực tiếp
-
Sự khác biệt giữa JavaScript và Python


Có thể bạn quan tâm
-
Code JavaScript tạo biểu đồ/đồ thị đường sai số
-
Code JavaScript tạo biểu đồ & đồ thị sai số
-
Code JavaScript tạo biểu đồ phân tán với các dấu tùy chỉnh
-
Code JavaScript tạo mẫu biểu đồ Pareto với nhãn Index/Data
-
Code JavaScript tạo mẫu biểu đồ/đồ thị box & whisker với màu tùy chỉnh
-
Code JavaScript tạo biểu đồ/đồ thị phân tán/điểm


- Công nghệ
- Học CNTT
- Quiz công nghệ
- Microsoft Word 2016
- Microsoft Word 2013
- Microsoft Word 2007
- Microsoft Excel 2019
- Microsoft Excel 2016
- Hàm Excel
- Microsoft PowerPoint 2019
- Microsoft PowerPoint 2016
- Google Sheets - Trang tính
- Code mẫu
- Photoshop CS6
- Photoshop CS5
- Lập trình Scratch
- HTML
- Học Python
- CSS và CSS3
- Học SQL
- Lập trình C
- Lập trình C++
- Lập trình C#
- Học HTTP
- Bootstrap
- SQL Server
- JavaScript
- Học PHP
- jQuery
- Học MongoDB
- Unix/Linux
- Học Git
- NodeJS
-
- Download
- Tiện ích
- Khoa học
- Điện máy
- Cuộc sống
- Video
- Ô tô, Xe máy
- Làng Công nghệ
 Linux
Linux  Đồng hồ thông minh
  Chụp ảnh - Quay phim
  macOS
macOS  Phần cứng
  Thủ thuật SEO
  Kiến thức cơ bản
  Dịch vụ ngân hàng
  Lập trình
  Dịch vụ nhà mạng
  Dịch vụ công trực tuyến
  Nhà thông minh
  Quiz công nghệ
  Microsoft Word 2016
  Microsoft Word 2013
  Microsoft Word 2007
  Microsoft Excel 2019
  Microsoft Excel 2016
  Google Sheets - Trang tính
  Code mẫu
  Photoshop CS6
  Photoshop CS5
  Bootstrap
  Ứng dụng văn phòng
  Tải game
  Tiện ích hệ thống
  Ảnh, đồ họa
  Internet
  Bảo mật, Antivirus
  Họp, học trực tuyến
  Video, phim, nhạc
  Giao tiếp, liên lạc, hẹn hò
  Hỗ trợ học tập
  Máy ảo
  Điện máy
  Tủ lạnh
  Tivi
Tivi  Điều hòa
  Máy giặt
  Quạt các loại
  Cuộc sống
  Kỹ năng
  Món ngon mỗi ngày
  Làm đẹp
  Nuôi dạy con
  Chăm sóc Nhà cửa
  Du lịch
  Halloween
  Mẹo vặt
  Giáng sinh - Noel
  Quà tặng
  Giải trí
  Là gì?
  Nhà đẹp
  TOP
TOP  Ô tô, Xe máy
  Giấy phép lái xe
  Tấn công mạng
  Chuyện công nghệ
  Công nghệ mới
  Trí tuệ nhân tạo (AI)
  Anh tài công nghệ
  Bình luận công nghệ