 Công nghệ
  Windows
  iPhone
  Android
  Học CNTT
  Download
  Tiện ích
  Khoa học
  Game
Game  Làng CN
  Ứng dụng
 Code JavaScript tạo biểu đồ & đồ thị xếp chồng thanh

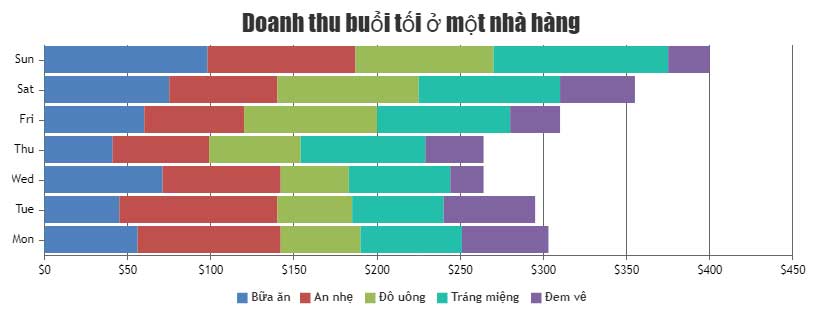
JavaScript Stacked Bar Charts được tạo bằng cách xếp chồng nhiều chuỗi dữ liệu với nhau. Điều này cho phép bạn so sánh tỷ lệ các chuỗi dữ liệu khác nhau với tổng số ở thời điểm bất kỳ. Biểu đồ Stacked Bar Chart được tạo bằng JavaScript có thể tương tác, hỗ trợ hoạt ảnh, thu phóng, xoay & xuất dưới dạng ảnh.
Ví dụ bên dưới minh hoạ một mẫu biểu đồ xếp chồng thanh được tạo bằng JavaScript. Bài viết bao gồm mã nguồn HTML mà bạn có thể chỉnh sửa trong trình duyệt hoặc lưu về máy để chạy nội bộ.
<!DOCTYPE HTML>
<html>
<head>
<script>
window.onload = function () {

var chart = new CanvasJS.Chart("chartContainer", {
	animationEnabled: true,
	title:{
		text: "Doanh thu buổi tối ở một nhà hàng"
	},
	axisX: {
		valueFormatString: "DDD"
	},
	axisY: {
		prefix: "$"
	},
	toolTip: {
		shared: true
	},
	legend:{
		cursor: "pointer",
		itemclick: toggleDataSeries
	},
	data: [{
		type: "stackedBar",
		name: "Bữa ăn",
		showInLegend: "true",
		xValueFormatString: "DD, MMM",
		yValueFormatString: "$#,##0",
		dataPoints: [
			{ x: new Date(2017, 0, 30), y: 56 },
			{ x: new Date(2017, 0, 31), y: 45 },
			{ x: new Date(2017, 1, 1), y: 71 },
			{ x: new Date(2017, 1, 2), y: 41 },
			{ x: new Date(2017, 1, 3), y: 60 },
			{ x: new Date(2017, 1, 4), y: 75 },
			{ x: new Date(2017, 1, 5), y: 98 }
		]
	},
	{
		type: "stackedBar",
		name: "Ăn nhẹ",
		showInLegend: "true",
		xValueFormatString: "DD, MMM",
		yValueFormatString: "$#,##0",
		dataPoints: [
			{ x: new Date(2017, 0, 30), y: 86 },
			{ x: new Date(2017, 0, 31), y: 95 },
			{ x: new Date(2017, 1, 1), y: 71 },
			{ x: new Date(2017, 1, 2), y: 58 },
			{ x: new Date(2017, 1, 3), y: 60 },
			{ x: new Date(2017, 1, 4), y: 65 },
			{ x: new Date(2017, 1, 5), y: 89 }
		]
	},
	{
		type: "stackedBar",
		name: "Đồ uống",
		showInLegend: "true",
		xValueFormatString: "DD, MMM",
		yValueFormatString: "$#,##0",
		dataPoints: [
			{ x: new Date(2017, 0, 30), y: 48 },
			{ x: new Date(2017, 0, 31), y: 45 },
			{ x: new Date(2017, 1, 1), y: 41 },
			{ x: new Date(2017, 1, 2), y: 55 },
			{ x: new Date(2017, 1, 3), y: 80 },
			{ x: new Date(2017, 1, 4), y: 85 },
			{ x: new Date(2017, 1, 5), y: 83 }
		]
	},
	{
		type: "stackedBar",
		name: "Tráng miệng",
		showInLegend: "true",
		xValueFormatString: "DD, MMM",
		yValueFormatString: "$#,##0",
		dataPoints: [
			{ x: new Date(2017, 0, 30), y: 61 },
			{ x: new Date(2017, 0, 31), y: 55 },
			{ x: new Date(2017, 1, 1), y: 61 },
			{ x: new Date(2017, 1, 2), y: 75 },
			{ x: new Date(2017, 1, 3), y: 80 },
			{ x: new Date(2017, 1, 4), y: 85 },
			{ x: new Date(2017, 1, 5), y: 105 }
		]
	},
	{
		type: "stackedBar",
		name: "Đem về",
		showInLegend: "true",
		xValueFormatString: "DD, MMM",
		yValueFormatString: "$#,##0",
		dataPoints: [
			{ x: new Date(2017, 0, 30), y: 52 },
			{ x: new Date(2017, 0, 31), y: 55 },
			{ x: new Date(2017, 1, 1), y: 20 },
			{ x: new Date(2017, 1, 2), y: 35 },
			{ x: new Date(2017, 1, 3), y: 30 },
			{ x: new Date(2017, 1, 4), y: 45 },
			{ x: new Date(2017, 1, 5), y: 25 }
		]
	}]
});
chart.render();

function toggleDataSeries(e) {
	if(typeof(e.dataSeries.visible) === "undefined" || e.dataSeries.visible) {
		e.dataSeries.visible = false;
	}
	else {
		e.dataSeries.visible = true;
	}
	chart.render();
}

}
</script>
</head>
<body>
<div id="chartContainer" style="height: 300px; width: 100%;"></div>
<script src="https://canvasjs.com/assets/script/canvasjs.min.js"></script>
</body>
</html>Nguồn: CanvasJS
Tùy biến biểu đồ
Bạn có thể thay đổi color (màu sắc) của từng chuỗi dữ liệu để dễ phân biệt hơn. Một số lựa chọn phổ biến khác bao gồm showInLegend - Hiện chú giải, shared(in toolTip) - chia sẻ tooltip, dataPointWidth - Độ rộng điểm dữ liệu, etc.
205
Bạn nên đọc
0 Bình luận
Sắp xếp theo
Xóa Đăng nhập để Gửi
Có thể bạn quan tâm
-

Code JavaScript tạo mẫu biểu đồ Pareto với nhãn Index/Data
-
Code JavaScript tạo biểu đồ/đồ thị phân tán/điểm
-
Code JavaScript tạo biểu đồ box và whisker chứa điểm ngoại lai
-
Code JavaScript tạo biểu đồ phân tán với các dấu tùy chỉnh
-
Code JavaScript tạo biểu đồ & đồ thị sai số
-
Code JavaScript tạo mẫu biểu đồ/đồ thị box & whisker với màu tùy chỉnh


- Công nghệ
- Học CNTT
- Quiz công nghệ
- Microsoft Word 2016
- Microsoft Word 2013
- Microsoft Word 2007
- Microsoft Excel 2019
- Microsoft Excel 2016
- Hàm Excel
- Microsoft PowerPoint 2019
- Microsoft PowerPoint 2016
- Google Sheets - Trang tính
- Code mẫu
- Photoshop CS6
- Photoshop CS5
- Lập trình Scratch
- HTML
- Học Python
- CSS và CSS3
- Học SQL
- Lập trình C
- Lập trình C++
- Lập trình C#
- Học HTTP
- Bootstrap
- SQL Server
- JavaScript
- Học PHP
- jQuery
- Học MongoDB
- Unix/Linux
- Học Git
- NodeJS
-
- Download
- Tiện ích
- Khoa học
- Điện máy
- Cuộc sống
- Video
- Ô tô, Xe máy
- Làng Công nghệ
 Linux
Linux  Đồng hồ thông minh
  Chụp ảnh - Quay phim
  macOS
macOS  Phần cứng
  Thủ thuật SEO
  Kiến thức cơ bản
  Dịch vụ ngân hàng
  Lập trình
  Dịch vụ nhà mạng
  Dịch vụ công trực tuyến
  Nhà thông minh
  Quiz công nghệ
  Microsoft Word 2016
  Microsoft Word 2013
  Microsoft Word 2007
  Microsoft Excel 2019
  Microsoft Excel 2016
  Google Sheets - Trang tính
  Code mẫu
  Photoshop CS6
  Photoshop CS5
  Bootstrap
  Ứng dụng văn phòng
  Tải game
  Tiện ích hệ thống
  Ảnh, đồ họa
  Internet
  Bảo mật, Antivirus
  Họp, học trực tuyến
  Video, phim, nhạc
  Giao tiếp, liên lạc, hẹn hò
  Hỗ trợ học tập
  Máy ảo
  Điện máy
  Tủ lạnh
  Tivi
Tivi  Điều hòa
  Máy giặt
  Quạt các loại
  Cuộc sống
  Kỹ năng
  Món ngon mỗi ngày
  Làm đẹp
  Nuôi dạy con
  Chăm sóc Nhà cửa
  Du lịch
  Halloween
  Mẹo vặt
  Giáng sinh - Noel
  Quà tặng
  Giải trí
  Là gì?
  Nhà đẹp
  TOP
TOP  Ô tô, Xe máy
  Giấy phép lái xe
  Tấn công mạng
  Chuyện công nghệ
  Công nghệ mới
  Trí tuệ nhân tạo (AI)
  Anh tài công nghệ
  Bình luận công nghệ
 Giới thiệu | Điều khoản | Bảo mật | Hướng dẫn | Ứng dụng | Liên hệ | Quảng cáo | Facebook | Youtube | DMCA
Giấy phép số 362/GP-BTTTT. Bộ Thông tin và Truyền thông cấp ngày 30/06/2016. Cơ quan chủ quản: CÔNG TY CỔ PHẦN MẠNG TRỰC TUYẾN META. Địa chỉ: 56 Duy Tân, Dịch Vọng Hậu, Cầu Giấy, Hà Nội. Điện thoại: 024 2242 6188. Email: info@meta.vn. Chịu trách nhiệm nội dung: Lê Ngọc Lam.
Bản quyền © 2003-2024 QuanTriMang.com. Giữ toàn quyền. Không được sao chép hoặc sử dụng hoặc phát hành lại bất kỳ nội dung nào thuộc QuanTriMang.com khi chưa được phép.